Public Expenditures
Joel Martin
Expenditures.RmdThis vignette explains the process done to get the data being used in the Mental Health and Disability Services dashboard.
Step 1: PDF Acquisition
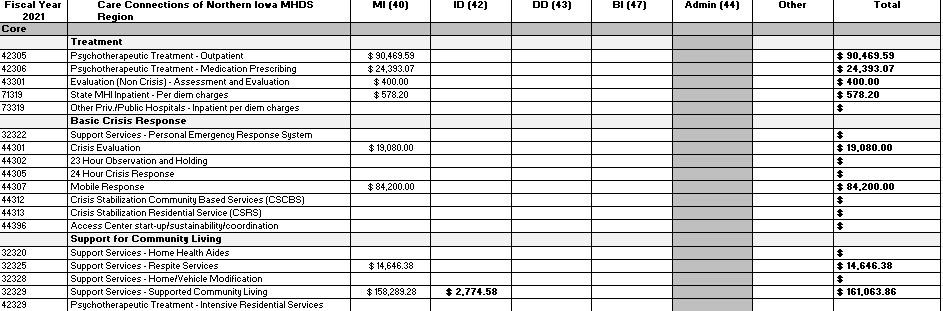
The first step was downloading all region expenditure PDFs for 2021.
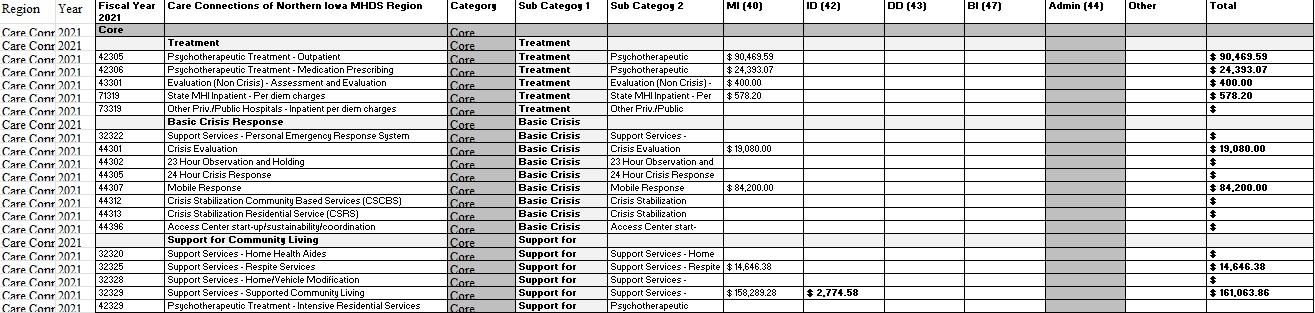
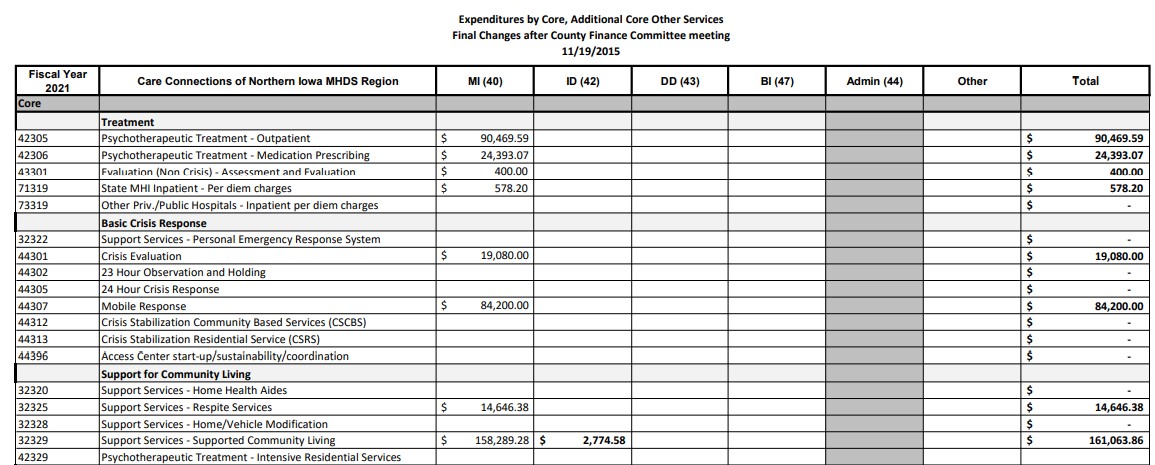
PDF Example:
Step 2: PDF Convertion to CSV
The next step was converting the PDFs to a CSV file.
After going through many different applications including excels import PDF, I found smallpdf.com that has a tool that correctly converted the PDFs to CSV files.
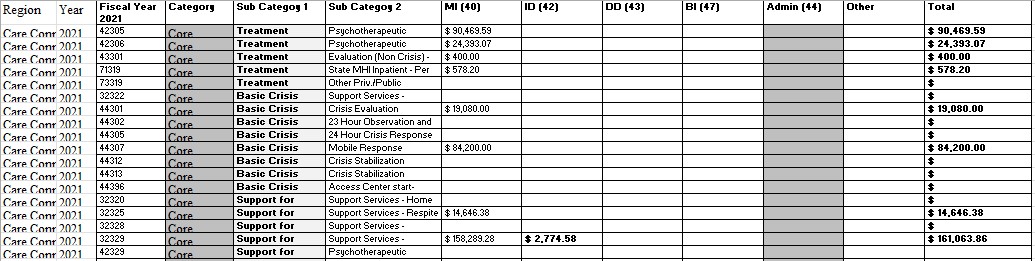
Here is an example of the smallpdf.com csv conversion file:
Step 3: Manual Cleaning
Unfortunately I was unable to come up with a solution to automating the cleaning of these PDFs in the period of time allotted for working on the MHDS expenditure data. The quickest way for me to clean them was manually. Here is the process done to each converted CSV file.
Step 3b: Create Four New Columns
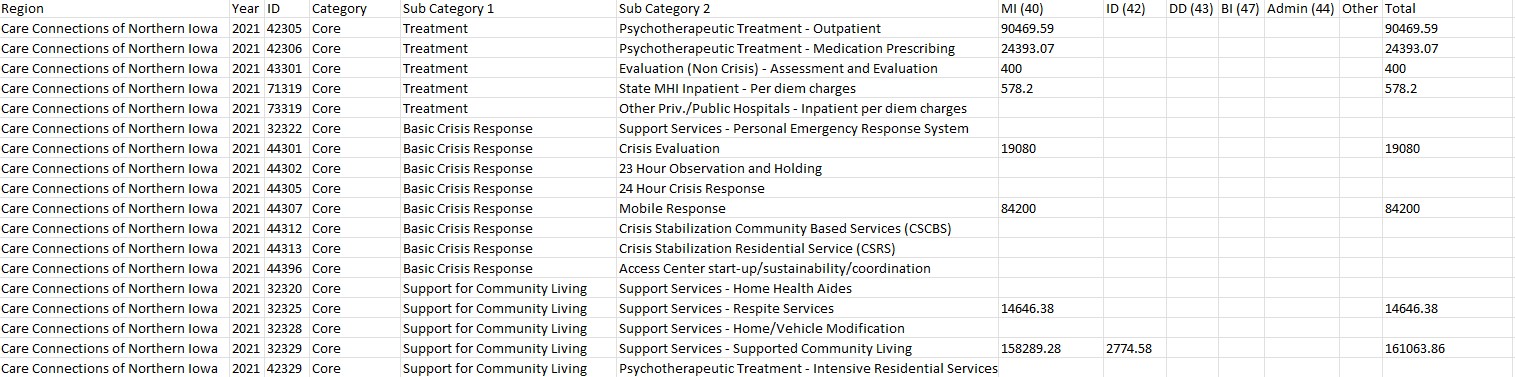
Columns were created for region, year, category, sub category 1, and sub category 2.
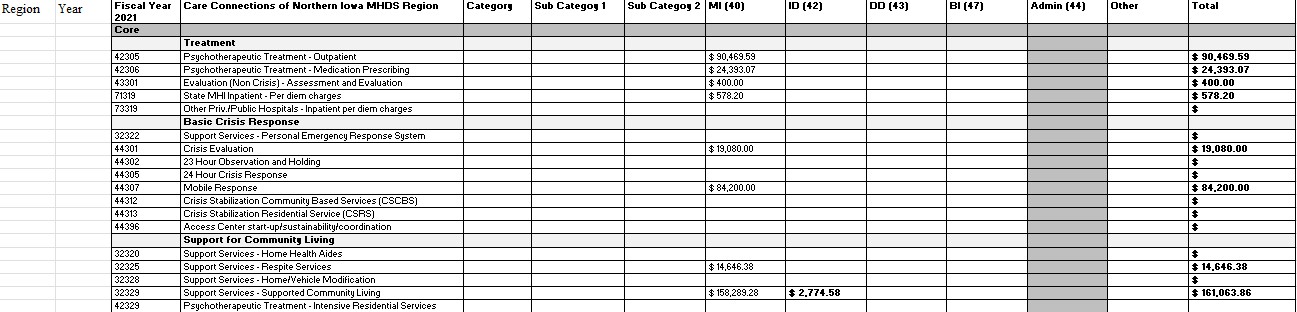
Step 3c: Population Columns
Next I populated the columns with the respective information. I used the dark colored bold lettered rows as the category, the lightly colored bold lettered rows as the sub category 1, and lastly the regular rows as sub category 2.